The below mentioned article includes a list of three experiments on air pollution.
1. Experiment to measure dust fall in any specified area:
Requirements:
Dust fall trappers, distilled water, physical balance, sieve, scale.
Dust fall:
Measurement of dust-fall provides a rough estimate of air pollution. The most common method used is the Dust-trap method, which has a sensitivity up to 0.2 g/m2/month. Dust fall trappers are exposed to atmosphere for a fixed period and the soil collected by them is weighed.
A dust trapper is generally kept at least 3 meter above the ground level and preferably on top of the roof in various areas such as residential, commercial, industrial, high-ways etc. To find out the actual dust fall in an area, samples should be taken regularly for at least a month.
Method:
A dust-fall trapper is an instrument containing a large grilled frame, dust fall jar and guard frame.
1. Keep the dust fall trappers in different localities of your area, about three meters above the ground.
2. Fill the distilled water in each trapper up to half of its level.
3. Add some fungicidal and algicidal compounds (e.g., copper) in the distilled water.
4. Take samples for 30 days. After the expiry of 30 days, bring the trappers to the laboratory for further treatments.
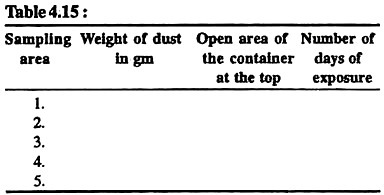
5. The dust suspended in water is sieved and weighed. Evaporate the supernatant for retrieving the insoluble portion and also add these weights. Record your observations in the following Table 4.15.
Observations:
Results:
Record the dust fall rate per gm./m2/month as follows:
Dust full rate (gm./m2/month) = Weight of dust/Open area of the container × 30/Number of days of exposure
2. Experiment to study the effects of air pollutants emitted by thermal power house or chimneys of large industries on the leaves of the plants:
Requirements:
Leaves of selected species collected from polluted area and unpolluted area, scale, safranin, glycerine, slides, coverslips, needles, brush, stage micrometer, ocular meter, microscope.
Method:
Smoke, dust, CO, SO2 and oxides of nitrogen are the common air pollutants emitted by chimneys of large industries, automobiles, power houses, etc. Thermal power houses emit SO2 as the major air pollutant.
The effects of these pollutants may be studied as under:
1. Collect leaves of selected species of plants from polluted area (in the vicinity of thermal power house or large industries) and unpolluted area (about 2.5 km away from the polluted area).
2. Measure length and breadth of lamina and length of petiole of all the leaves from two different areas.
3. Remove epidermal peels from both the surfaces of leaves of both areas, stain them, mount in glycerine and study under the microscope.
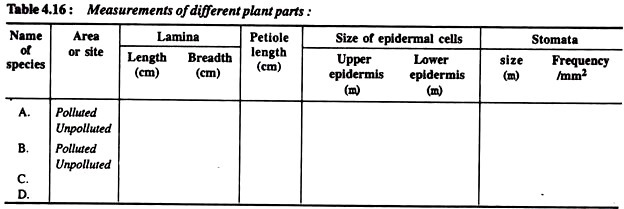
4. With the help of ocular meter, measure length and breadth of epidermal cells of both the epidermal layers, size of stomata, and frequency of stomata, and record your observations in the form of Table 4.16.
Observations of Exercise No. 38:
Results:
Generally, the length and breadth of lamina and petiole of leaves collected from polluted area are smaller than those collected from unpolluted area. The leaves collected from polluted area also possess comparatively smaller-sized stomata but their frequency is higher than those collected from unpolluted area.
3. Experiment to estimate bacterial composition of the air by standard plate count (SPC) method:
Requirements:
Nutrient agar medium, autoclave, petri-dishes, incubator.
Method:
1. Take about two dozen sterilized petri-dishes and pour in them the duly sterilized liquid nutrient agar medium.
2. Cover the petri-dishes immediately and allow the medium to solidify.
3. Expose six petri-dishes for one minute to the atmosphere, of which the bacterial composition of the air is to be estimated, i.e., laboratory, park, hospital, factory, temple, market and/or college, etc.
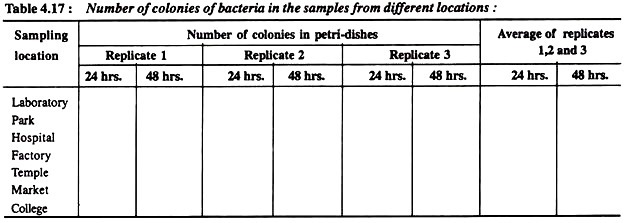
4. Cover the petri-dishes immediately after the exposure time and incubate half of them for 24 hours at 37°C and remaining half for 48 hours. Bacterial colonies will develop on the medium. Count the number of colonies with the help of a colony counter, record your observations in the Table 4.17 given below and analyse the data accordingly.
Observations:
Results:
The average of three replicates will give an idea about the places having highest and lowest bacterial populations. On being properly identified, it also becomes clear that which pathogenic bacteria are present in the region.


