Read this essay to learn about ecosystem. After reading this essay you will learn about: 1. Meaning of Ecosystem 2. Components of Ecosystem 3. Productivity 4. Diversity 5. Ecosystem Goods and Services 6. Homeostasis.
Essay Contents:
- Essay on the Meaning of Ecosystem
- Essay on the Components of Ecosystem
- Essay on Ecosystem Productivity
- Essay on Ecosystem Diversity
- Essay on Ecosystem Goods and Services
- Essay on Homeostasis in Ecosystem
Contents
Essay # 1. Meaning of Ecosystem:
An ecosystem is a system formed by the interactions of a variety of individual organisms with each other and with their physical environment. Ecosystems are nearly self-contained so that the exchange of nutrients within the system is much greater than exchange with other system.
An ecosystem, thus, is not entirely a biological entity. Any complete description of an ecosystem must include the physical environment as well as the biological components and the interactions between the two. Ecosystems are of diverse types-mostly natural, but there are a few which are man-made or modified by man’s activity.
Essay # 2. Components of Ecosystem:
An ecosystem is not entirely a biological entity. The biological or biotic components of an ecosystem include both living organisms and products of these organisms. Thus microbes, all categories of plants and animals as well as their waste products are included in the ecosystems.
The non-biological or abiotic components include climatic and edaphic features, in particular climatic components like sunlight, temperature, air and water supply along with soil component such as soil nutrients which are very important contributing factors of ecosystem operation.
The biotic components are broadly categorized as producers, and consumers of different classes viz. herbivores (animals that eat plants), carnivores (animals that eat flesh of other animals), omnivores (animals that consume both plants and animals as available) and lastly scavengers (animals that eat dead plant and animal matters).
In addition there are decomposer classes, which include mostly saprophytic organisms that help in nutrients and element recycling process.
Decomposers:
They are heterotrophic organisms that feed solely on dead organic matter, i.e., saprophytes. The bulk of the saprophytic decomposition is carried out by bacteria, fungi and protozoans. Imagine that a piece of organic Utter falls to the floor of a forest.
In a typical sequence, microscopic bacteria or fungi will excrete chemicals, called enzymes, that break down the complex chemical compounds in the object Some of the breakdown products are absorbed as food, whereas others are left behind.
These serve as a food supply for other organisms that carry the decomposition one step further. Eventually the waste products of the final line of decomposers are energy-poor mineral nutrients that are reabsorbed, and thus recycled, by plants — Fig. 5.1.
Essay # 3. Ecosystem Productivity:
During the process of production and consumption, energy is passed along, or flows, from one organism to another. For example, solar energy is converted to chemical energy within the leaves of green plants. The leaves can then be eaten by some herbivore, and the herbivore may, in turn, be eaten by a carnivore.
Consider a hypothetical ecosystem that receives 1,000 Kilocalories of light energy in a given day (Fig. 5.2). Most of this energy is not absorbed at all. Some is simply reflected back into space. Of the energy that is absorbed, most is stored as heat or used for evaporation of water. A small amount is assimilated by plants.
The productivity in an ecosystem are of two kinds—primary productivity and secondary productivity. The primary productivity of an ecosystem is the rate at which organic matter is produced during photosynthesis.
Some amount of photosynthetic material is subsequently utilized for respiratory purpose. The initial photosynthetic product which is formed at first is called gross primary productivity which is expressed as Kcal/m2/yr.
Only about half of the gross productivity accumulates as new plant matter, because the rest of the chemical energy is metabolized by the plant’s own respiration and released to the environment as heat. The net gain in plant matter is called the net primary productivity.
Thus the Net primary productivity = Gross primary productivity – Plant respiration
On the whole, productivity depends on a variety of factors such as sunlight, temperature, rainfall and the availability of nutrients. The total quantity of organic matter present at any one time in an ecosystem is called the biomass.
The biomass equals the total organic matter gained through net primary productivity over a period of time minus the quantity of material that is consumed and lost during respiration by animals. Let us return to the hypothetical ecosystem that receives 1,000 Kcal of sunlight (Fig. 5.2).
Although the efficiency of energy transfer varies from ecosystem to ecosystem, as an average value, of the 1,000 Kcal absorbed, only about 12 Kcal are utilized during photosynthesis. Of these 12 Kcal, 2 Kcal are used for plant respiration and about 10 Kcal are stored in the plant tissue as energy-rich material, which animals can use for food.
1,000 Kcal of sunlight → 988 Kcal lost to the environment + 12 Kcal stored as plant tissue.
The net primary productivity of various ecosystems varies distinctly. Among them tropical rain forests are most productive and rock, ice and sandy areas are least productive ecosystems (Table 5.2).
The variation in global patterns of primary production illustrates the range and variety of ecosystem character and functioning. The main factors affecting global patterns of primary production are light, heat, water, carbon dioxide and oxygen, and nutrient elements.
Occupying most of the Earth’s surface, the oceans provide an excellent example of how productivity varies with regional conditions. In the oceans there are very well-mapped and predictable patterns of primary productivity (Table 5.3).
Russian oceanographic research work during the 1960s defined five main productive regions of the oceans. In general, productivity is highest where there is a strong circulation of water, with upwelling currents brining deep water to the surface.
Nutrient concentrations tend to the greater in deep waters due to the continuous rain of material from shallow waters, down past the euphotic zone (where autotrophs can recycle the nutrients into the food chain). High productivity is commonest in shallow waters, where plants can grow to larger sizes.
Human impacts upon primary production are very important in many ecosystems. The broad pattern of natural environmental factors which control primary production at a global scale is shown in Table 5.4. This, however, provides only a generalized overview of ecosystem productivity (at biome level). The pattern of influence of the major limiting factors shown is frequently different at regional or local scales.
Secondary productivity is defined as the rate of formation of new organic matter by heterotrophs of the net primary productivity available in a forest, herbivores (e.g. insects, deer) eat only about 1-3%.
In grassland, as much as 15% of the vegetation may be eaten by herbivores. In the ocean, 80% of the net primary productivity is consumed by herbivores. Very little of the plant matter that is consumed is actually converted to animal tissue.
In terms of energy content, the conversion is only about 10 per cent. To summarise, although there are large variations from ecosystem to ecosystem, as a generalisation, for every 10 Kcal of plant tissue available to herbivores, about 1 Kcal will be eaten, and only about 0.1 Kcal will be stored in the form of body weight.
Carnivores that eat herbivores are likewise inefficient in converting food to body weight, so the energy available to the carnivore is even less. It is obvious, then, that the amount of usable energy decreases, as it is transferred from sunlight to plants to animals.
Thus there is a decreasing quantity of energy available at each trophic level. As a consequence, there will be a decreasing mass of organisms at each level. This relationship can be shown as Fig. 5.3 and called “energy pyramid”.
i. Food Chain and Food Webs:
The flow of food energy in an ecosystem progress through a food chain in which one step follows another—primary consumers eat producers, secondary consumers eat primary consumers, and so on. Within any ecosystem there are two major food chains, the grazing food chain and the detrital food chain (Fig. 5.4).
The two-food chains are distinguished by their source of energy or food for the initial consumers. In grazing ecosystems autotrophs, or living plant tissues, are the primary source of energy for the initial consumers, the herbivores. In the detrital food chain, the initial consumers, primarily bacteria and fungi, use dead organic matter, detritus, as their source of energy.
ii. Grazing Food Chains:
The grazing food chain is the one more obvious to us. Cattle grazing on pastureland, deer browsing in the forest, rabbits feeding in old fields, and insect pests feeding on garden crops represent the basic consumer groups of the grazing food chain.
Although highly conspicuous, the grazing food chain is not the major food chain in terrestrial and many aquatic ecosystems. Only in some aquatic ecosystems do the grazing herbivores play a dominant role in energy flow.
Voluminous data exist on phytoplankton productivity, filtration rates by grazing zooplankton, and production efficiencies of zooplankton. Few data, however, are available on the flow of energy, rate of grazing, biomass turnover rates for phytoplankton, and turnover of zooplankton biomass within the same aquatic system.
In terrestrial systems, a small proportion of primary production goes by way of the grazing food chain. Over a three year period, only 2.6 per cent of net primary production of a yellow-poplar forest was used by grazing herbivores, although the holes made in the growing levels resulted in a loss of 7.2 per cent of photosynthetic surface.
iii. Detrital Food Chains:
The detrital food chain is common to all ecosystems, but in terrestrial and littoral ecosystems it is the major pathway of energy flow.
In yellow-poplar (Liriodendron tulipifera) forests, 50 per cent of gross primary production goes into maintenance and respiration, 13 per cent is accumulated as new tissue, 2 per cent is consumed by herbivores, and 35 per cent goes to the detrital food chain.
Two-thirds to three-fourths of the energy stored in a grassland ecosystem that is un-grazed by cattle is returned to the soil as dead plant material, and less than one-fourth is consumed by herbivores.
Of the quantity consumed by herbivores, about one- half is returned to the soil as feces. In the salt march ecosystem, the dominant grazing herbivore, the grasshopper, consumes just 2 per cent of the net production available to it.
iv. Supplementary Food Chains:
Other feeding groups, such as the parasites and scavengers, form supplementary food chains in the community. Parasitic food chains are highly complicated because of the life cycle of the parasites. Some parasites are passed from one host to another by predators in the food chain.
External parasites (ectoparasites) may move from one host to another. Other parasites are transmitted by insects from one host to another through the blood-stream or plant fluids.
However, natural systems are rarely so orderly and linear. Many organisms occupy several trophic levels simultaneously.
For example, a raven can be a primary consumer when it eats corn, a secondary consumer when it eats grasshoppers, and a tertiary consumer if it manages to catch a shrew or small snake. In addition, ravens will eat dead animals and are, therefore, also scavengers.
In nearly all natural ecosystems, the patterns of consumption are so complicated that the term food web is more descriptive because there are many cross-links connecting the various organisms (Fig. 5.5).
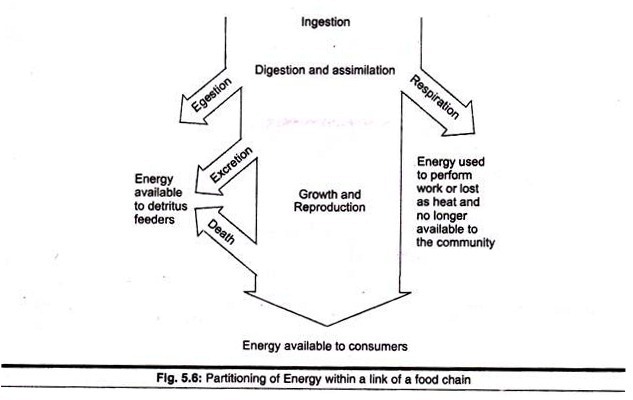
Once food is eaten, its energy follows a variety of pattern through the organisms. Not all food can be fully digested and assimilated. Hair, feathers, insect exoskeletons, cartilage and bone in animal foods and cellulose and ligin in plant foods cannot be digested by most animals. These materials are either egested by defecation or regurgitated in pellets of indigested remains.
Organisms use most of the food energy that they assimilate into their bodies to fulfil their metabolic requirements:
Performance of work, growth and reproduction. Because biological energy transformations are inefficient, a substantial proportion of metabolized food energy is lost, unused, as heat. Organisms are no different from man-made machines in this respect.
Most of the energy in gasoline is lost as heat in a car’s engine rather than being transformed into the energy of motion. In natural communities, energy used to perform work or dissipated as heat cannot be consumed by other organisms and is forever lost to the ecosystem.
Assimilated energy that is not lost through respiration or excretion is available for the synthesis of new biomass through growth and reproduction. Populations lose some biomass by death, disease or annual leaf drop, where they enters the detritus pathways of the food chain.
The remaining biomass is eventually consumed by herbivores or predators and its energy thereby enters the next higher trophic level in the community (Fig. 5.6).
v. Energetic Efficiencies:
The movement of energy through the community depends on the efficiency with which organisms consume their food resources and convert them into biomass. This efficiency is referred to as the food chain or ecological efficiency.
Ecological efficiencies are determined by both internal, physiological characteristics of organisms and their external, ecological relationships to the environment. To understand the biological basis of ecological efficiency, one must dissect the individual link of the food chain into its component parts (Fig. 5.7).
Ecological efficiency depends on the efficiencies of three major steps in energy flow exploitation, assimilation and net production (Table 5.5).
The product of the assimilation and net production efficiencies is the gross production from efficiency—the percentage of the exploitation and gross production efficiencies is the food chain or ecological efficiency—the percentage of available food energy in prey converted into consumer biomass.
The measurement of energy flow through an entire community is a complex and virtually impossible task. Yet the total flux of energy and the efficiency of its movement determine the basic trophic structure of the community, number of trophic levels, relative importance of detritus and predatory feeding, steady state values for biomass and accumulated detritus and turnover rates of organic matter in the community.
Each of these properties, in turn, influences the inherent stability of the community.
The study of energy transformation by plants and animals does, however, provide a useful insight into the basis of ecological efficiency and the trophic structure of the community.
Plants are terrible predators as they harness light energy, animals, however, have different problems—they have feeding ability and thus consume organic mass and energy assimilation takes place thereafter. Energy flow between trophic levels represents the sum of the feeding activities of many species.
Individual populations usually consume only a small fraction of available food resources. Carnivores, seed-eaters and aquatic herbivores are most efficient; the commonest species consume 10 to 100% of the food available to them. Terrestrial herbivores usually consume only 1 to 10% of the leafy vegetation.
Essay # 4. Ecosystem Diversity:
Ecosystem varies widely, with respect to both its biotic and abiotic composition and their interactions. Broadly speaking, habitat wise there are two major categories of ecosystem, viz., terrestrial or land ecosystem or biome and aquatic ecosystem. Each of them, again, is divided into several ecosystem types depending on atmospheric temperature, rainfall and soil or substrate nature.
The habitat condition varies widely from coastal areas, to mountains, deserts, hills, and alluvial plains in both tropical and subtropical zones. Habitat wise, major land ecosystems are thus depicted in the Fig. 5.8. The major ecosystem types in terrestrial habitat are these-grassland, rain forest, deciduous forest, mountain, desert, coastal, alpine and glacier zones etc.
Two major abiotic factors regulate the plant community structure in terrestrial habitat viz., rainfall and temperature. The major plant communities were tropical rain forest, temperate rain forest, tropical seasonal forest, temperate forest, thorn forest or savanna, woodland or grassland, taiga, desert and tundra zones.
The distributional pattern of major terrestrial biomes are given in Fig. 5.9. The overall topography and biotic composition of each of the zones described above are quite unique and distinguishable one from another (Fig. 5.10). In many cases human interference on such ecosystems leads to alteration of climate, landscape and so also the composition of species.
Though plants were widely adapted to climatic changes, yet major climatic factors govern the successional pattern of biological species in different habitat zones. Three distinctive successional profiles of plant communities is depicted in Fig. 5.11, to show the influence of climatic gradients on community formation.
With respect to aquatic ecosystem there were quite a good number of diversities. The major types were lake, open sea, coastal water, coral habitats, rivers, ponds, reservoir and swampy region etc. The life forms vary widely in each of the ecosystem zones.
Even within a single ecosystem zone there are distinctive regions where, due to variation of ecological niche, species composition varies widely in diversities and density. Two clear examples of species distribution in a lake and in ocean are depicted in separate figures i.e., Figs. 5.12 and 5.13.
Lake Environment:
A lake is a large water body mostly static or rarely having a flow system. From biological viewpoint, a lake has a number of layers:
1. Compensation level, the depth at which light energy is just sufficient for photosynthesis to balance the respiratory needs of primary producers.
2. Euphotic zone, this layer lies above the compensation level.
3. Profoundal zone, this layer lies below the compensation level.
Within the Euphotic zone, again, there are two subdivisions—the shallow littoral zone, deeper limnetic zone. The phytoplankton’s are mostly dominant in limnetic zone and abundant in littoral zone. There are occasional blooms also. Zooplanktons and swimming nektons are also abundant in limnetic zone.
The profoundal zone, by definite, lacks sufficient light per photosynthesis (i.e., < 1% of total incident light), it is, therefore, dominated by consumers. This zone has greater amount of debris i e more of organic load. The most productive lakes are those with a large littoral zone in relation to their volume.
Here, sunlight reaches most of the lakes waters, providing an energy source for the primary producers in addition to significant warming during the growing season.
Shallowness of the water allows the development of a large biomass of lightly productive rooted aquatic plants. Phytoplankton blooms are characteristic because of high inorganic nutrient concentrations produced as bottom micro-organisms degrade large volumes o organic matter.
Since profoundal waters have low oxygen concentrations, stagnation of bottom water is relatively frequent. Such shallow, highly productive lakes are termed Eutrophic lake.
In contrast, Oligotrophic lakes are much less productive. An oligotrophic lake is usually deep and steep-sided, with a narrow littoral zone. Concentrations of inorganic nutrients are low, and so is phytoplankton density. Blooms are rare, for the intense competition for nutrients keep population levels low.
Dissolve oxygen is high in the hypolimnion; its large volume, low temperatures and low input of organic matter serve to keep oxygen depleting microbes in check. Cold water bottom pushes such a lake trout or landlocked salmon find suitable habitats in the profoundal zone.
Essay # 5. Ecosystem Goods and Services:
Each and every ecosystem provides a number of goods and services to mankind directly or indirectly. These includes material supply like food, fiber, fuel, medicines and bio-chemicals; or it helps in control of flood, erosion, habitat protection, waste recycling, recreation and so on. An example of provisioning of goods and services of estuarine ecosystem is shown in Table 5.6.
Essay # 6. Homeostasis in Ecosystem:
Ecosystems are capable of self-maintenance and self-regulation as are their component populations and organisms.
Thus cybernetics—the science of controls, has important application in ecology, especially since man increasingly tends to disrupt natural controls or attempts to substitute artificial mechanisms for natural ones. ‘Homeostasis‘ is the term generally applied to the tendency for biological systems to resist change and to remain in a state of equilibrium.
However, the control depends on ‘feedback’, either in positive or negative ways. The positive feedback is deviation accelerating, while negative feedback is deviation counteracting. Both natural and man-made activities induced the changes in the ecosystem, but regulated feedback mechanism tends to resist the same; thus, somewhat, homeostasis is maintained.
In every ecosystem, there are three basic components:
Inputs, internal cycling and output, those are influenced by soil & climate. The input of nutrients to the ecosystem depends on the type of biogeochemical cycle.
Nutrients with a gaseous cycle, such as carbon and nitrogen, enter the ecosystem via the atmosphere. In contrast, nutrients such as calcium and phosphorus have sedimentary cycles, with inputs dependent on the weathering of rocks and minerals.
Primary productivity in ecosystems depends on the uptake of essential mineral (inorganic) nutrients by plants and their incorporation into living tissues. Nutrients in organic form, stored in living tissues, represent a significant proportion of the total nutrient pool in most ecosystems.
As these living tissues senescence, the nutrients are returned to the soil or sediments in the form of dead organic matter.
Various microbial decomposers transform the organic nutrients into a mineral form, a process called mineralization, and the nutrients are once again available to the plants for uptake and incorporation into new tissues. This process is called internal cycling and is an essential feature of all ecosystems. It represents a recycling of nutrients within the ecosystem.
The export of nutrients i.e., output from the ecosystem represents a loss that must be offset by inputs if a net decline is not to occur. Export can occur in a variety of ways, depending on the nature of the specific biogeochemical cycle.
Carbon is exported to the atmosphere in the form of CO2 via the process of respiration by all living organisms. Likewise, a variety of microbial and plant processes result in the transformation of organic and inorganic nutrients to a gaseous phase that can subsequently be transported from the ecosystem in the atmosphere.
Examples of these processes will be provided in the following sections, which examine specific biogeochemical cycles. A generalized model is shown in Fig. 5.25. The feedback systems as available in internal cycling balances the homeostasis of ecosystem.
