The following points highlight the five methods of sampling plant communities. The methods are: 1. Transect Method 2. Bisect 3. Trisect 4. Ring Counts 5. Quadrat Method.
1. Transect Method:
When the vegetation is to be studied along an environmental gradient or eco-tone (e.g. tropical to temperate, high or low rainfall areas or precipitation gradient, adjacent areas with different types of soil, etc.) a line is laid down across a stand or several stands at right angles. This method of linear sampling of the vegetation is called transect.
Depending upon the object of study, two types of transect can be drawn:
(1) Line Transect or Line Intercept; and
(2) Belt Transect.
The extent of area determines the number and size of transects. When transects are used to sample the vertical distribution of vegetation (i.e. stratification) they are called ‘bisects’.
1. Line Transect:
In this type of transect the vegetation is sampled only over a line (without any width). A line is laid over the vegetation with a metric steel tape or steel chain or long rope and kept fixed with the help of pegs or hooks. This line will touch some plants on its way from one point to the other. The observer will start recording these plants from one end and will gradually move towards the other end.
From this type of transect following information could be collected:
(a) The number of times each species appears along the line,
(b) The trend of increase or decrease of distance between the individuals of a species,
(c) The percentage of occurrence of different species in relation to the total species,
(d) The gradual disappearance or appearance of different species along the line, etc.
From the observations in a number of such parallel line transects, comments can be made on the habitat and other environmental conditions on different portions of the transect. Every species has its own ecological amplitude and tentatively expresses the status of available water and other edaphic conditions, atmospheric humidity, availability of light, grazing and other biological pressures, etc.
Exercise 2:
Demonstrate the Gradual Floristic Change in Two Different Types of Adjacent Plant Communities:
Date: _____________________________ Day Temperature:
Locality: ___________________________ Climatic Zone:
Total Area:_________________________ Relative Humidity:
Altitude:___________________________ Annual Precipitation:
Principle:
When two different types of vegetation develop side by side a gradual change of species content is generally seen in the intermediate region. For understanding the mode of such change the communities are generally studied by line transect method.
Requirements:
(i) A long thread or a rope,
(ii) A measuring tape,
(iii) Two surveyor’s hooks or long nails.
Procedure:
A thread or a rope or a long measuring tape is laid across the stand or stands in the communities under study and fixed with two hooks at two ends. Record individual plants touching the thread and the distance from a particular end.
Results:
Every individual plant touching the rope from one end to the other is recorded in Table 3:
Inference:
From the gradual change of the concentration of different species in different portions of the transect and the new arrival or disappearances of species, comments can be made on the habitat conditions of two communities and the transitional region.
2. Belt Transect:
The belt is a long strip of vegetation of uniform width. The width of the belt is determined according to the type of vegetation or the stratum of vegetation under study. In close herbaceous vegetation it is usually 10 cm, but it varies from 1 to 10 m in woodland.
The length of the vegetation is determined according to the purpose of the study. If a transect is essential then the lines should be marked using deep-seated wooden pegs at regular intervals. A belt could be kept isolated by installing tall wire-net fence on all its sides keeping safety-space from lines.
A belt is generally studied by dividing it into some equal sized segments. The length of each segment is generally equal to the width of the transect. These segments are sometimes called quadrats. Belt transects are used in determining and understanding the gradual change in abundance, dominance, frequency and distribution of different species in the transitional region between two different types of vegetation.
Exercise 3:
Demonstrate the Gradual Change of Abundance and Frequency of Different Species in a Transitional Zone following the Belt Transect Method:
Principle:
For understanding the gradual change in density and frequency of different species in the transitional region between two different types of vegetation the area is generally studied by Belt Transect method (Fig. 1.10).
Requirements:
(i) Long threads or ropes,
(ii) Measuring tape,
(iii) Surveyor’s hooks or nails; and
(iv) Graph paper.
Procedure:
Place two hooks 50 cm apart at both ends of the transect (A & B and C & D). Connect these two sets of nails by long threads (A & C and B & D). Place more nails along these two lines at every 50 cm (F, G, J, etc. and E, H, I, etc.). Connect these nails crosswise with threads.
Now, a series of quadrate (e.g. ABEF, EFGH, GHD, etc.) have been demarcated along the transect. Distribute the quadrats into three distinct zones: I: the first vegetation type; II: the transition region and III: the second vegetation type.
The Density (D) and Frequency (F) of different species in different zones can be calculated using following formulae:
D = No. of individuals of the species in all the sample plots/No. of sample plots studied
F = No. of points of occurrences of the species/No. of sample plots studied
(Also refer Exercise Nos. 8 and 9.)
Results:
Record all the species along with their numbers in all quadrats (if a sharp change is apprehended) or the alternate quadrats (if the change appears to be very slow) in the following Table 4 and calculate their Density and Frequency.
Inference:
By transect method, one can estimate different qualitative and quantitative characters of the vegetation and can correlate the findings with the different environmental conditions.
Further, in Belt-Transect, it is possible to determine the basal area or cover (by introducing another column in the Table) of all the recorded species from which Density, Frequency and Importance Value Index also can be calculated.
2. Bisect:
The structure of vegetation with regard to the relative height, depth and lateral spread of plants in both aerial and underground parts could be determined by the use of bisects. It is essentially a line transect along which a trench has been dug to a depth greater than that of the deepest root systems.
The extent of different aerial and underground parts are carefully measured and plotted to scale on coordinate graph paper. This method reveals the form and interrelationship of underground systems of different species growing in the community and also their relationship to different types and/or layers of soil.
So, the bisect studies provide the following information:
(a) A rough floristic picture of the community,
(b) Stratigraphic distribution of different species,
(c) Utilization of space by different species,
(d) Underground structures of plants,
(e) Arrangement and extent of root-system, etc.
3. Trisect:
It is the photographic method of recording the dynamic characters of plant community. In this technique a particular plot of the vegetation is photographed periodically by keeping the camera in the same direction and at the same height. This is done by permanently fixing three wooden pegs at a place in the vegetation so that the bases of a tripod camera-stand can be set on these pegs.
The technique is effectively used in monitoring the degradation or the recovery of rangeland, secondary succession of a denuded place, spread of a disease or some newly introduced weed into the area, etc. As these changes take place gradually and very slowly it is essential to keep detailed and permanent record for comparison. A series of photographs very nicely provides that record.
4. Ring Counts:
The age of different types of woody plants (e.g. trees, shrubs, liana etc.) may be determined by counting the annual growth rings of the aerial or subterranean stems.
Growth rings can also reveal the climatic history of a place chronologically like the years of high rainfall or drought, presence of some chemical in the soil or atmosphere, forest fire, heavy snowfall etc. The method is also important in determining the successive stages of development of a vegetation and specially the sequence of dominants and subdominants.
5. Quadrat Method:
The quadrat is a square sample area of varying size marked-off in the plant community for the purpose of detailed study. Generally a number of quadrats are studied to acquire reasonably faithful data to realise different analytic and synthetic characters of the plant community.
It is also effectively used to determine the exact differences or similarities in the structure and composition between two or more plant communities of related or unrelated vegetation.
Quadrats can be of four types:
1. List Quadrat:
Enlisting the names of different species growing in the quadrat.
2. List-Court Quadrat:
Records the number of individuals of each species represented in each quadrat.
3. Chart Quadrat:
Records the position and areas covered by bunches, mats or tufts of grasses, mosses, etc. on the coordinated or graph paper. These graphs help to compare any change in structure of community in future.
4. Clip Quadrat:
For the study of biomass or weight of each species, all individuals are uprooted (but when the weight of a particular organ, e.g., branch, leaf, fruit, etc., is to be determined only the concerned organ is clipped or harvested) and its fresh or dry weight is recorded.
Demarcation or laying out of different types of quadrats are basically same. Generally, an adjustable wooden frame is prepared with perforations at regular intervals on each arm. Four arms are fixed in the field with the help of long nails or surveyor’s hooks and it is ready to provide data necessary for list, list- count and clip quadrat.
But, in chart quadrat more nails or hooks are fixed to the perforations on quadrat arms at regular intervals. Nails of opposite arms are connected by threads to divide the plot into a number of smaller quadrats to facilitate the recording of the area covered by individual plants on a coordinate paper in scale. When such wooden frames are not easily available it can be replaced by long threads or ropes.
The best size of quadrat to use in a community should be determined with care. It should be large enough and enough quadrats should be studied to produce reliable results.
Size of Quadrats:
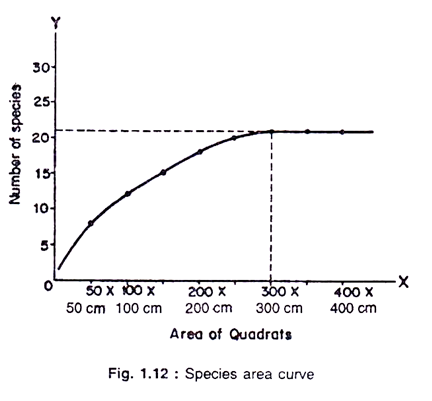
The size of quadrats to be used in a given community is determined by constructing a species area curve. This is done by sampling the vegetation with nested quadrat method.
Nested quadrats are a series of quadrats, laid one over the other with gradually increasing size and can be practiced in the following way:
Requirements:
(i) Long thread,
(ii) Surveyor’s hooks or long nails,
(iii) Measuring tape; and
(iv) Graph paper.
Procedure:
Put two nails ‘O’ and ‘ Y’ 5 m apart. Place the nail ‘X’ 5 m away from ‘O’ nail at right angle with the OY arm. Connect YO and OX by a long thread. Place the nails A and B on OX and OY, respectively, 50 cm away from ‘O’. Using another nail make a 50 cm x 50 cm square (Quadrat No. 1). Record all species growing in this quadrat.
Put another set of three nails increasing the length of arms 50 cm each (Quadrat No. 2). Record only newly found species in the list. Similarly, demarcate Quadrat Nos. 3, 4, 5 etc. increasing 50 cm arm length at every step. Continue the process so long as a recognisable number of new species is added each time (Fig. 1.11).
Results:
If the total number of species in every Quadrat (e.g. 4, 7, 9 etc. as in the table) are plotted on a graph paper against the area and number, respectively, for OX and OY axes, it will yield a sigmoid curve which is known as ‘Species area curve’ (Fig. 1.12).
Inference:
The size of the Quadrat which recorded the highest number of species should be selected as the size of Quadrat for sampling the community under study.
[For general practice a 1 m × 1 m Quadrat sample is used for herbaceous vegetation, 5 m × 5 m for shrubby vegetation and 20 m × 20 m for trees.]
Selection of Quadrats:
For studying any plant community a number of quadrats should be studied. As the collected data will be processed statistically, the quadrats should be layed at random, with no bias for any particular region within the community. There are a number of methods for such random selection of quadrats.
Two such methods are:
I. Collect or prepare a map of the area under study. Draw a number of vertical or horizontal lines and number them separately. The numbers of vertical and horizontal lines are to be written separately on small pieces of paper and keep these two sets of paper squares in two separate beakers.
Mix these numbers in each beaker. Draw one number from each beaker and mark the place where lines representing these two numbers have crossed. Draw such number pairs repeatedly to find out the positions of a desired number of quadrats and mark the places properly.
II. Enter the area with blindfolded eyes and a stick in hand. Throw the stick over your shoulder at different parts of the vegetation. Each such point where the stick falls should be selected as a sample area.
For experimental purposes sometimes quadrats are marked permanently with the help of deep-seated wooden-pegs at four corners and studied at different times according to the need of the working programme. To understand the biotic pressure on the vegetation like grazing, etc. or to record its developmental history, some sample plots are needed to be kept isolated by fencing them properly with wire-nets.
For practising these methods of studying vegetation following exercises may be worked out:
Exercise 4:
Determine the Ground Cover Flora of an Area by Quadrat Sampling:
Date:___________________________
Name of the Place: _______________ Annual Precipitation:
Altitude:________________________ Climatic Zone:
Day Temperature: ________________ Humidity:
Principle:
To determine the flora of a piece of vegetation the area should be sampled with a number of quadrats so that all the species growing there can get a chance to be recorded to give a total floristic picture.
Requirements:
(i) Long thread,
(ii) Four long nails; and
(iii) Measuring tape.
Procedure:
Randomly select five sample plots. Lay out one 1m × 1m (1sq.m) quadrat at a sample plot. Find out and record different species growing inside it. Repeat the process for all other four sample plots.
Result:
Different plant species growing in all the quadrats are now recorded in Table 6:
Now, the determined flora of the plant community under study is represented in Table 7:
Conclusions:
Comment on the species richness of the vegetation and also on some common and/or rare plants recorded in the area. Also, comment on the environment in which the vegetation has been developed, as reflected by the flora.
Exercise 5:
Determine the Flora of a Forested Area by Quadrat Sampling:
Date: __________________________Day Temperature:
Locality: _______________________ Climatic Zone:
Total Area: _____________________ Relative Humidity:
Altitude: _______________________ Annual Precipitation:
Principle:
To determine the flora of a forested area sampling should be done separately using quadrats of different sizes for trees, shrubs and herbaceous plants. Standard size of the quadrats for sampling trees, shrubs and herbs are 20 × 20 m (400 sq m), 5 × 5 m (25 sq m), and 1 × 1 m (1 sq m), respectively.
Requirements:
(i) Long threads,
(ii) 100 long nails, and
(iii) Long measuring tape.
Procedure:
Lay one 400 sq m quadrat in each of the 3-5 randomly selected sample plots. Within each such quadrat demarcate two 25 sq m and four 1 sq m quadrats. Mark each set of quadrats as in Fig. 1.13. Record canopy forming plants from 400 sq m quadrats, shrubs, shruby climbers and trees saplings from 25 sq m quadrats and herbaceous plants from 1 sq m quadrate.
Results:
Record different species of plants growing in different quadrats separately in Table 8:
Density and frequency of the recorded species of plants can be easily determined by introducing two more columns in Table 1 for number of individuals and points of occurrences.
Now, the determined flora of the plant community under study is represented in Table 2 (as in Table 9 of Exercise 4).
Conclusions:
Comment on the species richness of the vegetation and their stratigraphic distribution. Discuss the abundance, association etc. of different elements of the flora. Also, comment on the environment in which the vegetation has been developed, as reflected by the flora.
Exercise 6:
Determine Coverage and Dominance by Different Ground Covering Plants in a Sample Area:
Date: Total Area:
Name of the Place: Climatic Zone:
Altitude: Humidity:
Day Temperature: Annual Precipitation:
Principle:
The aerial portion of each and every individual plant covers some area in the vegetation. The total area covered by a species within the sample area tells for its dominance or importance to the community. In a multi-storeyed plant community such a study is conducted for every stratum of vegetation separately. The cover is generally determined by Chart Quadrat method.
Requirements:
(i) Long threads,
(ii) 40 nails (± 15 cm),
(iii) Measuring tape,
(iv) Graph paper and
(v) Pantograph.
Procedure:
I. Lay one 1 m × 1 m (i.e. 1 sq m) quadrat. Place nails at every 10 cm on each arm. Connect nails of opposite arms with threads to divide the 1 sq m quadrat into 100 small sq cm quadrats. Draw a replica of the layout in the scale of 1 cm = 10 cm on the graph paper.
Carefully draw the area occupied by individual species on the graph paper and mark them using separate symbols for each species. Find out the area covered by each species on the graph paper and multiply the numbers with 10.
For better results a number of areas should be studied. The area covered in a unit sample area could be multiplied by the area of the vegetation to determine the total area covered by a species or by different species (Fig. 1.14).
II. Lay one 1 m × 1 m quadrat. Fix the graph paper on a drawing board, set the pantograph on it and record the area covered by each species.
Calculate the Relative Dominance of different species using the formula:
Relative Dominance (R. Dm.) = Total coverage of the species/Total coverage of all the species × 100
Results:
Area occupied by each species in the sample area and percentage of total cover are recorded in the Table 10:
Conclusion:
Considering the natural adaptability and dominance of each species comment on the environment of the area and the vegetation structure.
Determine the Basal Area of Trees in a Forest:
Date: Total Area:
Locality: Climatic Zone:
Altitude: Humidity:
Day Temperature: Annual Precipitation:
Principle:
Basal area refers to the ground actually penetrated by the stems, and is readily seen when the leaves and stems are clipped at the ground surface. It is one of the chief characteristics to determine the relative dominance of a species and the nature of the community. It also helps to determine the yield.
Requirements:
(i) Long ropes,
(ii) Long wooden pegs, and
(iii) Measuring tape.
Procedure:
Demarcate a quadrat of 20 m x 20 m in size or larger, if essential, with the help of wooden pegs and ropes. Measure the circumferences of each stand (tree) at breast height with the help of a measuring tape.
The radius of each plant is calculated with the formula:
r = Circumference of the tree/2π
(r = radius; π = 3.14)
and then, the basal area of each plant is obtained by the formula
Basal area = πr2; or, 4πc2 (c = circumference of the tree).
The total basal area is obtained by summing up the basal areas of all the species.
The mean basal area per tree can be calculated as:
Mean Basal Area/Tree = Total Basal Area/Number of trees
The mean area of one stand multiplied by density (i.e. number of individuals/unit area) produce the basal cover/unit area.
The area coverage is used to express the dominance. The higher the coverage area the greater is the dominance. Relative Dominance (R. Dm.) of a species is the proportion of basal area covered by the species to the total basal coverage of all the species in the area:
Relative Dominance (R. Dm.) =Total Basal Area of the species/Total Basal Area of all the species × 100
Results:
Data recorded for computation and the results are presented in the following Table 11:
Conclusion:
Comment on the dominance of the determined dominant (i.e. with high R. Dm. value) trees and the major association they represent within the community. Also, try to inculcate the causes of such dominance, specially if the cause appears to be biotic.
Exercise 8:
Determine the Relative Density of Different Herbaceous Plants Growing in a Community:
Date: Total Area:
Name of the Place: Climatic Zone:
Altitude: Humidity:
Day Temperature: Annual Precipitation:
Principle:
The density of a species expresses its numerical strength within the community in relation to a definite area. Herbaceous species are extremely sensitive to different micro-climatic conditions and that is why their density varies greatly even in different portions of a particular type of vegetation.
In order to determine the Relative Density of the floristic members of a vegetation, the area should be sampled with List-cunt Quadrat method.
Requirements:
(i) Long thread,
(ii) Four long nails, and
(iii) A measuring tape.
Procedure:
Randomly select five sample plots. Lay out one 1 m x 1 m (1 sq m) quadrat in a sample plot. Find all the species growing inside the quadrat and record their population number (individuals). Repeat the process for four other sample plots.
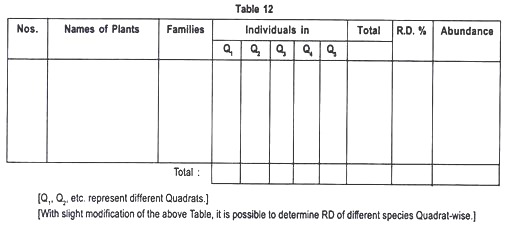
Density of a species can be determined according to the formula:
Density (D) = No. of individuals of the species in all the sample plots/Total number of sample plots studied
Relative Density (R.D.) = No. of individuals of the species/No. of individuals of all the species × 100
Density of a species indicates its abundance — so determine the abundance class using this data. Result
Different plant species growing in the five quadrats, their population number and the determined Relative Density are recorded in the following Table 12:
Conclusion:
Considering the natural adaptability of each species and their determined RD in the community, comment on the environment of the area and the vegetation. Also, comment on the abundance of different species. Prepare a list of species recorded with high RD.
Exercise 9:
Determine the Relative Frequency of Different Herbaceous Species Growing in an Area:
Date: Total Area:
Name of the Place: Climatic Zone:
Altitude: Humidity:
Day Temperature: Annual Precipitation:
Principle:
The individuals of all the species growing in an area are not evenly distributed. The distribution patterns of individuals of different species indicate their reproductive capacity as well as their adaptability to the environment. Frequency refers to the degree of dispersion in terms of percentage occurrence.
Requirements:
(i) Long thread,
(ii) Four long nails, and
(iii) A measuring tape.
Procedure:
Randomly select five sample plots. Lay out one 1 sq m quadrat in a sample plot. Find all the species growing inside the quadrat as in list quadrat method. Repeat the process for four other sample plots.
Frequency (F) and Relative Frequency (RF) can be calculated with the help of the following formulae:
Frequency (F) = No. of points of occurrences of the species/Total number of quadrats studied
Relative Frequency (RF) = No. of points of occurrences of the species/Total number of quadrats studied × 100
[Points of occurrences mean the number of samples or quadrats in which the species is growing.]
Now, a constancy class (or Presence) can be determined for each species using the classification:
Results:
Record different species of plants growing in five quadrats in the Table 13:
Conclusion:
Comment on the total number of species and their distribution within the vegetation.
Exercise 10:
Determine the Importance Value Index for Different Species Growing in a Herbaceous Plant Community:
Date:
Name of the Place:
Altitude: Climatic Zone: Total Area:
Humidity: Annual Precipitation: Day Temperature:
Principle:
Individual values of density, cover and/or frequency do not give a total picture of any species growing in a plant community. But the sum of these three values can give a better picture about their ecological importance.
Requirements:
(i) Long thread,
(ii) 40 nails,
(iii) A measuring tape,
(iv) Graph paper, and
(v) Pantograph.
Procedure:
Randomly select five sample plots and study them for the determination of Cover, Relative Density, Relative Frequency (as in Exercises 2, 3& 4). Find our the Importance Value Index (IVI) of all the recorded species with the formula IVI = R. Dm. + R.D. + R.F.
IVI of a species can also be presented in a Phyto-graph. Draw a circle and divide it into four equal quarters by two radial lines laying at right angles to each other. Divide the three radii from centre to circumference into 100 equal parts and the fourth radius into 300 parts.
Mark first three radii with R. Dm., & R.F. and the fourth with IVI. Place the values of R. Dm. R.D., R.F. & IVI of a species on their respective arms. Connect these four points and that will give a quadrangular phyto-graph for the species. In this way draw phyto-graphs of five species with the highest IVI scores.
Result:
Sampling data and the results can be presented in the Table 14:
Conclusion:
From the values of IVI, R. Dm., R.D. and R.F. of different ‘important’ species in the community under study, comment on their adaptability, distribution, association, etc..
