Fundamentals of Light Microscopy and Transmission Electron Microscopy:
Until the 1940s, most of our knowledge concerning the structure and organization of cells was obtained from studies conducted using light microscopy, and major structures and organelles, including the cell wall, nuclei, chromosomes, chloroplasts, mitochondria, vacuoles, centrioles, flagella, and cilia, had been described.The smallest distance, d, between two points resolvable as separate points when viewed through lenses is given by the relationship
d = 0.6λ/n sin α … (1 -1)
In this equation, λ is the wavelength of the light (radiation) that is used to illuminate the specimen; n is the refractive index of the air or liquid between the specimen and the lens; and a is the aperture angle. The product n sin α is called the lens numerical aperture, and for a good microscope lens its value is about 1.4. Equation 1-1 also shows that the resolving power of a microscope varies with the wavelength of the source of illumination. The human eye cannot directly detect light having a wavelength of less than about 400 nm (see Table 1-2 for the units of metric measurement).
Therefore, in the case of the light microscope, the maximum resolving power is about 0.6 x 400/1.4, or about 0.17µm. That is, points less than about 0.2 µm apart cannot be distinguished as separate points by light microscopy (in practice, the limit is closer to 0.5 µm).
From a practical standpoint, this means that even when glass optics of the finest quality are used, it is possible to observe cells at magnifications no greater than about 2000 x. Resolution is improved when sources emitting rays that have shorter wavelengths are employed. For example, the resolving power of the ultraviolet light microscope (which requires quartz optics because glass does not transmit ultraviolet light) is approximately double that of the light microscope.
Much greater resolution has been obtained with the electron microscope, developed in the 1930s, and with which magnifications of several hundred thousand are a practical possibility. The wavelength of radiations used with the electron microscope is typically about 0.005 nm (0.05 Å). Although resolution of an Angstrom or less is theoretically possible, the practical limit is about 5 Å.
This is many thousand times greater than those attainable using microscopes with glass optics. The basic features of a transmission electron microscope (abbreviated TEM) and shown in Figure 1-1, and a comparison between the component parts of the TEM and the light microscope is depicted diagrammatically in Figure 1-2.
In the last decade, the scanning electron microscope (SEM) has become an increasingly important tool of the cell biologist. The SEM employs quite different principles than the TEM and will be considered separately later. In both the light and electron microscopes, the source of radiation is an electrically heated tungsten filament.
In the light microscope, the light emitted from the glowing filament is focused by a condenser onto the specimen to be observed. In the transmission electron microscope, the condenser focuses electrons emitted by the excited tungsten atoms into a beam, and electrodes accelerate the beam toward the specimen.
Whereas the condenser of a light microscope consists of one or a few glass lenses, the condenser of the electron microscope consists of several large, circular electromagnets. Indeed, all “lenses” of the electron microscope are electromagnets. In both microscopes, the radiation passes through the specimen and is then refocused by the objective lenses.
The last lens of the light microscope is the ocular, through which the image may be viewed with the eye. The image of the electron microscope is viewed after its magnetic projection onto a zinc sulfide screen. The molecules of the screen are excited by the impinging electrons and emit visible light during their return to the ground state. Alternatively, the image may be captured on photographic film housed in a special camera mounted below the movable zinc sulfide screen.
The lenses of the light microscope have a fixed focal length and are focused by moving them nearer to or further from the specimen. In the electron microscope, focusing is accomplished by manipulating the amount of current flowing through the windings of the series of electromagnetic lenses. This alters the electromagnetic field through which the electron beam must pass. The column through which the electron beam passes must be evacuated of air. If the vacuum is inadequate, the electrons will be scattered by collisions with residual gas molecules.
Consequently, the specimen, the filament, the electromagnets, and the zinc sulfide screen are all mounted within a sealed compartment (i.e., a “column”) that is connected to a vacuum pump. To avoid excessive scattering or absorption of electrons by the specimen itself, the material to be examined must be cut into extremely thin sections.Two special forms of light microscopy warrant further description because of their widespread use and special application; these are phase-contrast microscopy and fluorescence microscopy.
Phase-Contrast Microscopy:
Although most regions of an unstained cell are transparent, they may have different densities and therefore different refractive indexes. Consequently, light rays travel through these regions at different velocities and may be refracted or bent to different extents.
The phases of light rays that pass directly through an object and those that pass across its edges (i.e., at the interface where the refractive index changes) will necessarily be altered. The change increases the contrast between the object in focus and its surroundings.
In the phase-contrast microscope, the phases of light rays entering the object are shifted by an annular diaphragm below the condenser. The phases of the rays passing through and around the object are shifted again by a phase plate in the objective lens. The result is a striking increase in the contrast of the object as certain regions appear much brighter (owing to additive effects of rays brought into phase) while other regions appear much darker (owing to the canceling effects of rays shifted further out of phase).
The effect can be seen in Figure 1-3. Because phase-contrast microscopy produces added contrast in the material being studied without the need to employ stains, the technique is especially useful when examining living materials.
Fluorescence Microscopy:
Certain chemical substances emit visible light when they are illuminated with ultraviolet light. The effect is termed fluorescence and is put to use in the fluorescence microscope in which ultraviolet light rays are focused on the specimen. Some cellular components possess a natural fluorescence and appear in various colors.
Other, non-fluorescing structures can be made to fluoresce by staining them with fluorescent dyes (fluorochromes). One of the most popular contemporary uses of fluorescence microscopy involves the preparation of antibodies that will bind to specific cellular proteins.
The antibodies are first complexed with fluorescein (a fluorescent dye) and the fluorescein-labeled antibody is then applied to – the cells. Cell structures containing the specific proteins capable of binding the fluorescein-labeled antibody are caused to fluoresce when examined with the fluorescence microscope, dramatically revealing their detail (Fig. 1-3).
Image intensifiers and microspectrofluorometers can also be coupled to fluorescence microscopes to provide images of or detect the presence of very small quantities of labeled molecules. Such adaptations provide sensitivities to as few as 105-106 molecules. In recent years, there have also been amazing advances in computer enhancement of the microscopic images.
Preparation of Materials for Microscopy:
The preparation of biological material for examination with either the light microscope or the transmission electron microscope involves a series of physical and chemical manipulations that include:
(1) Fixation,
(2) Embedding,
(3) Sectioning, and
(4) Mounting.
Fixation One notable advantage of the light microscope is the capability to observe whole, living cells. It is also possible to employ “vital stains,” which improve contrast but do not interfere with normal cell activity. More frequently, however, the cells are first killed and fixed.
The fixation step is intended to preserve the structure of the- material by preventing the growth of bacteria in the sample and by precluding postmortem changes. Formaldehyde and osmium tetroxide (OsO4) are examples of fixatives most often employed for light microscopy. OsO4 has a very high electron density, and because this gives contrast to the resulting image, OsO4 has also found widespread use as a fixative in electron microscopy.
Other popular fixatives include potassium permanganate and glutaraldehyde. After fixation for the required length of time, the samples are dehydrated by successive exposures to increasing concentrations of alcohol or acetone.
Embedding Cells or tissues to be examined by light microscopy are usually embedded in warm, liquid paraffin wax. The wax, which both surrounds the tissue and infiltrates it, hardens on cooling, thereby supporting the tissue externally and internally. The resulting solid paraffin block is then trimmed to the appropriate shape before being sectioned.
The ultrathin sections required for electron microscopy necessitate the use of harder embedding and infiltrating materials such as epoxy plastics. These initially are in liquid form and are poured into small molds containing pieces of the fixed tissues; on heating, the liquid undergoes polymerization to form a hard plastic (Fig. 1-4).
Sectioning:
The trimmed blocks containing the embedded samples are sectioned using a microtome (Fig. 1-5). In this instrument, the block is sequentially swept over the blade of a knife that cuts the block into a series of thin sections that adhere to one another end-to-end and thereby form a ribbon.
Between each stroke, the distance between the block and knife edge is shortened. For light microscopy the microtome knives are usually constructed of polished steel and can provide sections several micrometers thick. The sections for electron microscopy must be much thinner (typically 100 to 500 Å) and require more elaborate microtomes (called ultra-microtomes). Moreover, either diamond knives or knives prepared by fracturing plate glass are used in place of polished steel. Figure 1-6 illustrates the preparation of a ribbon of sections during ultramicrotomy.
Mounting:
Sections prepared for light microscopy are mounted on glass slides and may be stained with dyes of various colors that specifically attach to different molecular constituents of the cells. Sections to be examined with the electron microscope are generally not stained (no colors are seen with the electron microscope), although contrast may be improved by “post-staining” with electron-dense materials such as uranyl acetate, uranyl nitrate, and lead citrate.
The sections are mounted on copper “grids” (small disks perforated with numerous openings) that have been coated with a thin (sometimes monomolecular) film of carbon (Fig. 1-7). The grid supports the film, which in turn supports the thin section.
Thus the beam of electrons must pass through the spaces of the grid, the supporting film, and the section before striking the fluorescent screen. A comparison of photomicrographs obtained with the light microscope and the TEM is given in Figure 1-8; the difference in resolution is striking.
Specialized Applications of Transmission Electron Microscopy:
Shadow Casting In shadow casting, the sample (usually containing small particles such as viruses or macromolecules) is spread on a coated grid, which is then placed in an evacuated chamber. A chromium or platinum wire is heated until the metal is vaporized, and the vapor is deposited onto the sample at a precise angle.
The metal piles up in front of the sample particles but leaves clear areas behind them. If the resulting electron photomicrographs are printed in reverse, the areas containing the electron-dense metal that had piled up against the particles appear light, while the electron-transparent areas behind the particles appear as dark shadows (Fig. 1-9). Because the vaporized metal atoms tend to be projected in a straight line, the shadows are cast at precise angles, and in this manner the general shape and profile of a particle may be discerned.
Negative Staining In the negative-staining procedure, the sample (again small particles such as viruses or macromolecules) is surrounded by an electron- dense material, such as phosphotungstic acid, that permeates the open superficial interstices of the sample. When the excess stain is carefully washed away, the sample particles appear as light (i.e., electron- transparent) areas that are highlighted by the surrounding dark background (Fig. 1-10).
Freeze-Fracturing:
Freeze-fracturing is a technique in which the tissue is first fractured (i.e., cracked) along planes of natural weakness that run through each cell. These planes generally occur between the two layers of lipid molecules that comprise part of the limiting, membrane around the cells’ various vesicular organelles. Figure 1-11 depicts the basic differences between sectioning and fracturing.
The tissue to be freeze-fractured is first impregnated with glycerol and then frozen at -130°C in liquid Freon. The frozen tissue is transferred to an evacuated chamber containing a microtome and steel knife (also maintained at about -100°C using liquid nitrogen). The microtome knife is used to produce a fracture plane through the tissue (Figs. 1-12a and 1-12b).
When the plane of the fracture intersects the membrane of a vesicular structure (e.g., nucleus, mitochondrion, vacuole, etc.), the membrane is split along its center, producing two “half-membranes.” These are called the E (for “exterior”) half and P (for “protoplasmic”) half.
The E half formerly faced the cell’s external phase (see below) and the P half faced the internal phase (i.e., the protoplasm). One surface of each half-membrane is the original membrane surface (the E and P surfaces of Figs. 1-12c and 1-12d) and the other surface is the newly exposed fracture face (the EF and PF surfaces of Figs. 1-12c and 1- 12d). The vacuum of the chamber is then used to sublimate water on the cut surface to a depth of several hundred Angstroms.
New membrane faces exposed by sublimation are termed Es and Ps (Fig. 1-12c). An electron-dense combination of metal (usually carbon and platinum) is then deposited on the cut surface at an angle and piles up in front of and behind projections from the surface, as well as in pits and depressions (Fig. 1-12d). Additional carbon is added to form an electron-transparent backing.
The shadowed and coated tissue is removed from the chamber and the tissue itself is either floated off or dissolved away, thereby leaving only the carbon- platinum “replica” (Fig. 1-12e). The replica is trimmed to the proper size, placed on a grid, and examined with the transmission electron microscope. Note that the replica is actually a template-like impression of the distribution of particles in the original specimen.
The electron beam readily passes through portions of the replica containing the carbon but is absorbed by the areas containing the platinum. The resulting images, which have a three-dimensional impact, are considerably different from those obtained with sectioned materials (Fig. 1-13).
The shadowing angle used in preparing the replica is usually indicated in the resulting photomicrograph (shown in the bottom-left corner of Fig. 1-13). It is essential that the photomicrographs be viewed along the shadowing angle otherwise depressions in the surface may be seen as projections (and vice versa). This is vividly demonstrated in the paired photographs of Figure 1-14.
The rate at which the specimen is cooled prior to fracturing markedly influences the effectiveness of the technique. Effective cryofixation of the specimen demands very rapid cooling such that water in the specimen passes quickly from an amorphous liquid state into an amorphous solid state (forming what is called “vitreous ice”).
If the cooling rate is too slow, the water forms ice crystals, which, because of their ordered structure, deform and damage cellular components. Early efforts employing the freeze-fracture technique produced replicas containing many crystalline arrays resulting from insufficiently rapid cryofixation.
The Scanning Electron Microscope:
Scanning electron microscopy has become an increasingly popular technique since its introduction as a biological tool in the 1960s. With this technique, the surface topography of a specimen may be examined in considerable detail. At the present time, resolution is on the order of 30 Å.
The organization of the scanning electron microscope (SEM) is shown in Figure 1-15 and is similar in many respects to that of the TEM. However, instead of the electron beam passing through (i.e., being “transmitted” by) the specimen, the interaction of the electrons of the beam (called “primary” electrons) with the surface of the specimen causes the emission of “secondary” electrons from the surface.
 The beam rapidly scans back and forth over the surface of the specimen, thereby producing bursts of secondary electrons. Greater numbers of secondary electrons are produced when the beam strikes projections from the specimen surface than when the beam enters a pit or depression in the surface.
Hence, the number of secondary electrons produced at each point on the specimen surface, as well as the direction in which scattering occurs, depends on the surface topography. Therefore, there are quantitative and qualitative differences in the secondary electron bursts produced by the scanning electron beam. These ultimately give rise to an image in the following way.
Secondary electrons ejected at each point on the specimen surface are accelerated toward a positively charged scintillator located to one side of the specimen. Light scintillations created on impact of these electrons with the scintillator are conducted by a light guide to the photocathode of a photomultiplier tube. Electrical pulses produced in the photomultiplier tube are then amplified, and the resulting signal is relayed to a cathode-ray tube.
The result is an image much like that of a television picture, consisting of light and dark spots. The scanning of the specimen surface by the primary electron beam is synchronized with the projection of a beam on the television screen in such a way that each portion of the specimen is reproduced in a corresponding region of the television image.
Samples to be examined are usually coated first with a metal (typically a gold-palladium alloy), forming a layer 10 nm or more thick, and then are affixed to a supporting disk that is placed in the beam path. The metal coating efficiently reflects the primary electrons of the beam and also produces large numbers of secondary electrons.
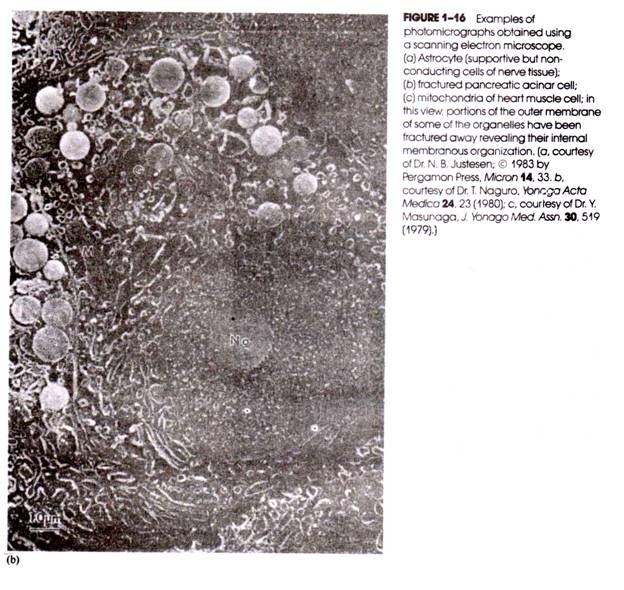
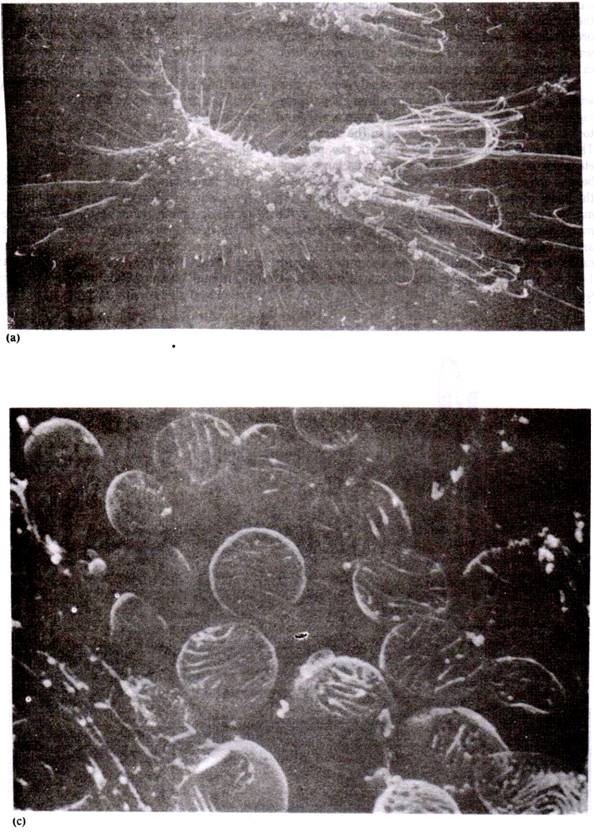
It is to be noted that the thickness of the metal coating directly influences the maximum resolution attainable; for example, if the metal coating is 10 nm thick, then two particles that are less than 20 nm apart could not be resolved because their metallic coatings are contiguous. Figure 1-16 contains examples of photomicrographs obtained with the SEM.
Because the specimen being examined with the SEM can be rotated, it is possible to obtain views from different angles. This provides additional information about the size, shape, and organization of the material being studied. For example, Figure 1-17 contains two scanning electron micrographs of the same cluster of chains of the bacterium Simonsiella taken from different angles.
Stereo Microscopy (Stereoscopy):
True three-dimensional (i.e., stereoscopic) images of the specimen being studied can be obtained if one photomicrograph is taken as though the specimen were being viewed with the left eye only, and a second is obtained representing the right eye view. (The two views are obtained by a minor tilting of the sample in the horizontal plane.)
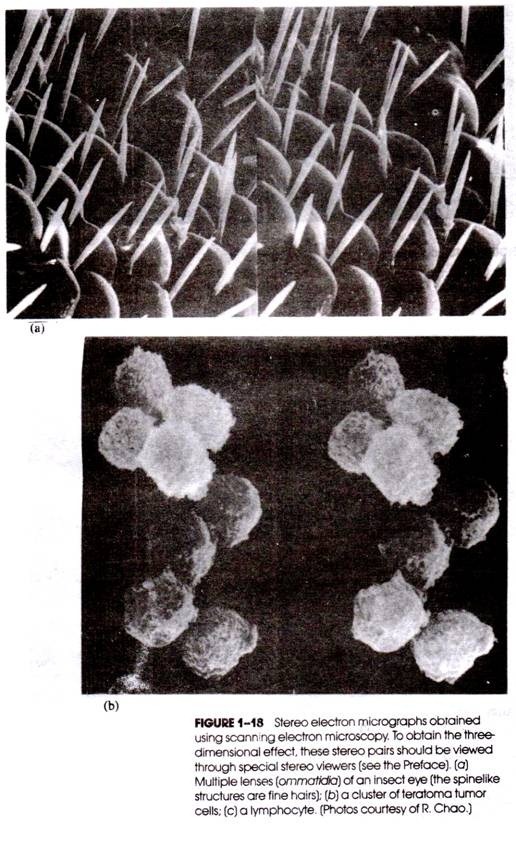
When the two photomicrographs are placed side-by-side and the stereo pair is viewed through the appropriate pair of lenses (called “stereo viewers”; see the Preface), a striking three- dimensional impression is seen, revealing details and geometric relationships that cannot be discerned from a single photomicrograph. Stereo views of the surface topography of tissues and cells are readily obtained with specimens prepared for SEM study; illustrations are presented in Figure 1-18.
The internal organization of cells is revealed in three dimensions by high-voltage transmission electron stereoscopy. In this procedure, cells are placed or cultured on a conventional grid and then fixed and dehydrated. The grid and cells are sandwiched between layers of carbon and are examined in a TEM in which the accelerating voltage is great enough to penetrate the entire thickness of the cell (about 1 million volts).The cells are photographed at various tilt angles to produce the stereo pairs needed for the three- dimensional image (see Fig. 1-19).
The viewing of stereo-micrographs may present some difficulties, especially for the novice. Generally, fewer problems are encountered with SEM stereoscopic views (e.g., Fig. 1-18) because the objects in the photomicrographs are opaque (i.e., certain objects are clearly in front of others).
Transmission stereo-micrographs are more difficult to assimilate and interpret because most of the objects are translucent. However, no other procedure provides direct images of the three-dimensional morphology of the cell’s interior. A single stereo pair can reveal the entire population of mitochondria, lysosomes, or other organelles (see below) distributed through the cell.

