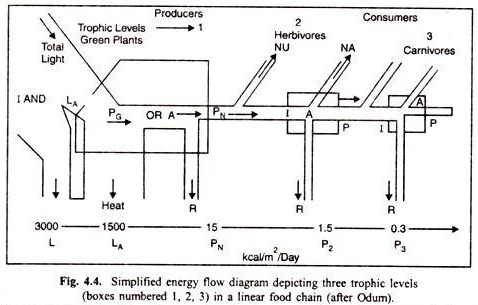
The relationship between the standing crop and the energy flow is very important.
In the energy flow diagram (Fig. 4.4), the “boxes” represent the biomass of the standing crop of organisms functioning at the trophic level indicated, and the “pipes” represent the energy flow in and out of each level.
The energy flows are greatly reduced with each successive trophic level, whether we consider the total flow (A), or the production (P), or respiration (R) components. Similarly, in many cases, the standing crop also decreases.
The standing crop biomass is much influenced by the size of the individual organisms forming the trophic level in question. According to the inverse size-metabolic rate principle, the smaller the organism the greater would be the rate of metabolism per gram of weight.
For example, one gram of small algae may be equal in metabolism to many grams of forest tree leaves. Thus, if the producers of an ecosystem are formed of very small organisms, and the consumers are large, the standing crop of consumers may be greater than that of the producers, though the energy flow of the producers must be greater.
The sea ecosystem is a typical example of such a situation in which the consumers (clams, crustaceans, echinoderms, fish and the like) often outweigh the producers (microscopic phytoplankton) on which they depend. By harvesting at frequent intervals, man (as well as the clam) may obtain as much food (net production) from mass cultures of small algae as he obtains from a grain crop harvested after a long interval of time.
However, the standing crop of algae at any one time would be much less than that of a mature grains crop. The standing crop biomass is usually expressed in terms of grams of organic matter, grams of carbon, or calories per unit area; but productivity is expressed as grams or calories per unit time, and the relationship between the two depends on the kind of organisms involved.
