After reading this article you will learn about introduction and accounts of path co-efficient analysis.
Introduction to Path Coefficient Analysis:
Path analysis was proposed by Wright in 1921 and was used first for plant selection by Dewey and Lu in 1959. Path analysis is simply standardized partial regression coefficient partitioning the correlation coefficients into the measures of direct and indirect effects of set of independent variables on the dependent variable. It is also known as cause and effect relationship.
For example, in sesame, yield (x4) is mostly contributed by plant height (x1), total capsules/plant (x2) and seeds/capsule (x3).
Path analysis will indicate whether the association of the yield related traits with yield is due to their direct effect on yield (true association and selection can be made for improvement), or is a consequence of their indirect effect via some other traits (s) and in such cases geneticist has to select the trait through which the indirect effect has been exerted.
Path analysis is carried out using the estimates of correlation coefficients.
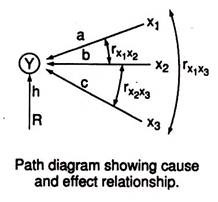
Y is yield (effect) of the causal factors x1, x2 and x3 (yield-related components’); r designate association between variables; a, b, c and h are path coefficients due to respective variables and R is residual effect.
Accounts of Path Co-Efficient analysis:
Path coefficient analysis takes into account the followings:
1. Direct Effect:
Using the values of correlation coefficients and with the help of path diagram following simultaneous equation can be set up:
In the path diagram P14 = a, P24 = b and P34 = c and are direct effects of variables x1, x2 and x3 respectively on the dependent variable Y (yield). Putting the values of the correlation coefficients in the above equations, the values of P14, P24 and P34 are estimated by the process of elimination.
Example 1:
In sesame plant height (x1), capsules/plant (x2) and seeds/ capsule (x3) are yield components and their associations and relationship with yield (4) are as follows.
2. Indirect Effects and Direct Effects:
Values of correlation coefficient and those of direct effects are put to compute indirect effects.
(a) Plant Height (x1) and Yield (x4):
(b) Total Capsules/Plant (x2) and Yield (x4):
(c) Seeds/Capsule (x3) and Yield (x4):
3. Residual Effect can be Calculated From:
1 = P2R4 + P214 + P224 + P234 + 2P14r12P24 + 2P14T13P34 + 2P24r23P34.
P2R4 is the square of residual effect = 0.6224.
Path coefficient analysis revealed that the direct contribution of total number of capsules/plant was high and positive (P24 = 0.6320) which was followed by seeds/capsule (P34 = 0.4090). Poor negative direct contribution was recorded for plant height (P14 = —0.1732).
The indirect effects via plant height were poor and negative in all cases; while indirect effects via total capsule/plant and seeds/capsule were positive and substantial. Total (direct and indirect) effect of plant height, capsules/plant and seeds/capsule has been recorded as 0.5599, 0.72 and 0.6198, respectively. High residual effect (0.6224) was observed.


