After reading this article you will learn about the correlation and linear regression analysis.
Correlation:
Association between variables or attributes or characteristics at a given time is known as correlation.
Example:
(i) The amount of rainfall and yield of a certain crop;
(ii) Age of husband and wife;
(iii) Height and weight of students and
(iv) Different concentrations of mutagen and their effect on seed germination frequency.
In plant breeding the breeders targets improvement of yield. Relationship between yield and yield related traits (plant height, number of primary branches/ plant; total branches/plant, number of capsules/plant, capsule length, seeds/capsule, 100-seed weight, etc.) and between the yield related components can be worked out through correlation studies.
Significant correlation obtained will be helpful for selection and ascertaining the model plant type for the concerned species.
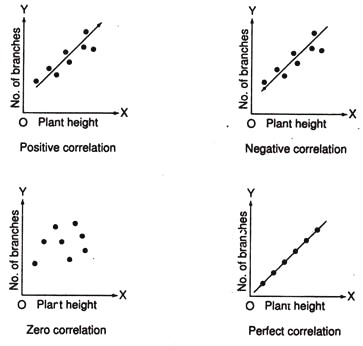
Precisely correlation may be defined as movement of one variable tend to be accompanied by corresponding movements in the other. Such simultaneous movement of two variables can be graphically plotted using value of one variable on x-axis and the other variable along y-axis.
Such representation of variables indicates the nature of association between the attributes and is called as scattered diagram or correlation chart.
Correlation may:
(a) Positive Correlation:
Increase in plant height is related to increase in number of branches per plant. On the scattered diagram the dots (each pair of observation) representing the variables are in a linear path diagonally across the graph paper from bottom left-hand corner to the top right.
(b) Negative Correlation:
For example, increase in plant height of a species is related to decrease in branch number per plant. The pattern of dots be such as to indicate a straight line path from the upper left-hand corner to the bottom right.
(c) Zero Correlation:
The dots are scattered and do not indicate any straight line.
(d) Perfect Correlation:
When the dots lie exactly on a straight line.
In the present example height of plants represented independent variable and on the other hand the variable which changes with the change in the independent variable is called dependent variable (branches/plant).
It is customary to use the horizontal axis (x-axis) for the independent variable and the vertical axis (y-axis) for dependent variable.
The degree of relationship between 2 attributes can be determined by calculating a coefficient called as correlation coefficient. The correlation coefficient is expressed by the letter ‘r’. r varies from 0 to 1 and can be + (positive correlation) or — (negative correlation). Practically, r is never zero or 1 (complete/absolute).
Whenever correlation coefficient analysis is made, r-value ranges from 0 to 1 but it is necessary to compare the calculated r-value with table value at specific degree of freedom. If the value is significant, i.e., if the calculated r-value is greater than table value, then only we can say that the two attributes are statistically associated to one another. Degree of significance level has also to be assessed (5%, 1% and 0.1% levels).
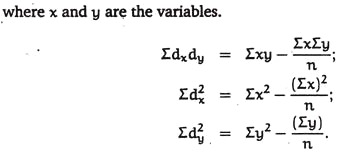
where x and y are the variables.
In correlation degree of freedom is n — 1, where n represents pairs of observations.
Example 1:
Ten plants have been assessed in sesame (Til) for plant height (cm) and number of branches per plant. From the given data do you consider that there exist correlation (significant) between the variables?
Solution:
Inference:
The calculated value 0.996 for 9 DF is higher than the tabulated value at 5%, 1% and 0.1% levels and hence it can be suggested that the two variables are positively and significantly correlated between them at 0.001 probability level.
The r-value can be represented as 0.996*** to show the level of significance.
Thus, selection of plants with higher height will facilitate selection of plants with enhanced number of branches.
How to prepare Correlation Table from Experimental Data:
Following data has been given:
a. Plant height and number of primary branches/plant = 0.65
b. Plant height and total branches per plant = 0.57.
c. Height and number of capsules per plant = 0.81**.
d. Height and yield = 0.62.
e. Primary branches and total branches = 0.35.
f. Primary branches and capsules per plant = 0.80**.
g. Primary branches and yield = 0.87***.
h. Total branches and number of capsules = 0.52.
i. Total branches and yield = 0.43.
j. Capsules per plant and yield = 0.82**.
Tabulated:
Inference:
Interrelationship between four yield related traits and their association with yield have been documented in tabular form. Result indicated positive and significant correlation between height and capsules/plant (1% level), primary branches/plant and capsules/plant (1% level), primary branches and yield (0.1% level) and capsules/plant and yield (1% level).
Thus, plants having higher number of primary branches with enhanced capsule number should be the selection indices for higher yield in the plant species.
Simple correlation described so far is of 3 types:
Observable correlation between 2 variables and it includes both genotypic and environmental effects.
Such type of correlation takes into account the inherent association between two variables and it may be the outcome of pleiotropic action of genes or linkage or both.
P cov x. y, G cov x.y and E cov x.y are phenotypic, genotypic and environmental, respectively, covariance’s between variables x and y; Vx and Vy are variances for x and y variables, respectively.
Partial Correlation:
X1 and X2 estimated by taking into account the effect of a 3rd variable X3 and is denoted as r12.3.
Partial correlation provides better relationship between the two variables X1 and X2 and is given by the formula:
r12, r13 and r23 are the estimates of simple correlation coefficients between the variables X1 and X2, X1 and X3 and X2 and X3, respectively.
Multiple Correlation:
Estimate of joint influence of two or more variables on a dependent variable is called multiple correlation. Such an estimate helps in understanding the dependence of one variable, say x1 on a set of independent variable say X2, X3
The square root of R21.23 is the estimate of multiple correlation coefficient. R21.23 is coefficient of determination.
Linear Regression Analysis:
The statistical analysis employed to find out the exact position of the straight line is known as Linear regression analysis. From simple correlation analysis if there exist relationship between independent variable x and dependent variable y then the relationship can be expressed in a mathematical form known as Regression equation.
From regression equation we can work out the actual value of y variable (dependent) based on X variable (independent) and such values plotted graphically will give precise nature of the straight line (point of interception to y-axis can be noted).
Simple regression equation Yx = a + bx, where a and b are constant which minimize the residual error of Y. Y is the dependent variable.
The constants a and b can be obtained from the formula:
Example 2:
From the data find out the regression equation and draw a regression line on the graph paper.
Using the regression equation yx = 2.6+1.48x the actual values of dependent variable can be worked out.
Using data of the given example the straight line is drawn but the point of interception to y-axis is lacking and, therefore, precise nature of the straight line is not understood. However, from the straight line it is evident that the variables were significantly and positively correlated between themselves.
These set of values plotted graphically will give a straight and the precise nature of the straight line can be obtained from x = 0, y = 2.6 (point of interception to y- axis can be found out).
Multiple Regression:
Example 3:
The following data giving mean yield (grain), mean ear number per plant and mean grain number per acre of 10 wheat varieties were obtained in low soil condition moisture plots in the experiment conducted at IARI during 2000-01 to study the influence of soil drought on the relation between yield and ear character.
Fit a multiple regression equation giving mean grain yield in terms of mean ear no. per plant and mean grain no. per ear.
Since the calculated value of F in respect of regression is greater than the table value both at 5% and 1% level of significance, the regression is highly significant. Thus, mean grain yield is significantly related to ear characters.


