In this article we will discuss about the design of ultraviolet disinfection system.
George Tchobanoglous, Frank Loge and Jeannie Darby
Department of Civil and Environmental Engineering University of California at Davis Davis CA 95616, USA
Marvin Devries
Trojan Technologies Inc., 3020 Gore Road London, Ontario, Canada N5V 4T7
Abstract:
Deterministic and probabilistic approaches to the design of ultraviolet (UV) disinfection systems are reviewed and discussed. Field data that must be collected to apply each method are identified. An empirical model to predict UV disinfection performance is presented and discussed.
The advantage of the probabilistic approach is that the variability in the wastewater characteristics, the variability in the field test data, and the statistical nature of the discharge requirements are reflected in the design of the UV system.
Introduction to the Design of Ultraviolet Disinfection System:
Currently, a deterministic approach is used for the design of low-pressure UV systems. The information required for design is based on using the results of field studies or from collimated beam tests. In some cases, collimated beam tests are used in conjunction with field tests.
Recently, a probabilistic approach has been developed for the design of UV systems. The purpose of this paper is to review the two methods used for the design of UV disinfection systems.
The specific topics to be considered herein include:
(a) A general description of the two approaches to the design of UV disinfection facilities,
(b) A comparison of the two design approaches, and
(c) Future developments.
Background:
The design of an ultraviolet disinfection system involves two primary steps. First, either the minimum UV dose or the maximum UV loading necessary to meet the discharge requirements of a particular wastewater treatment plant must be determined.
Second, the process configuration of the UV disinfection facility must be determined, consisting of the number of lamps per module, the number of modules per bank, the number of banks per channel, and the overall number of channels necessary to treat the design flow rate (generally the peak weekly flow rate).
Calculation of the Minimum UV Dose with Method 1 (Deterministic Approach):
A common method of calculating the minimum UV dose necessary to meet the discharge requirements of a wastewater treatment plant is to develop a plot of the log of the microorganism inactivation data versus UV dose, obtained using either a collimated beam in the laboratory or a field scale ultraviolet disinfection system.
A typical plot is shown in Figure 1. Given a desired effluent coliform concentration (N), the required UV dose can be back calculated from this plot. This design approach is deterministic because neither variable wastewater quality nor variable permit requirements are accounted for explicitly.
The UV dose is generally defined by the following equation:
Three methods have been reported in the literature for calculating the average intensity within a UV reactor:
(a) Mathematical,
(b) Biological assay, and
(c) Chemical actinometry.
By far most frequently used method to calculate intensity is the mathematical method called the point source summation (PSS) method. A computerised version of the PSS method is outlined in detail in USEPA, 1992. The exposure time is generally calculated based on the assumption of approximate plug flow conditions within the UV reactor. Tracer tests should be conducted to verify this assumption.
Calculation of the Maximum UV Hydraulic Loading with Method 2 (Probabilistic Approach):
The UV hydraulic loading is defined as the flow rate can be disinfected per watt of UV lamp output, and is calculated using the following equation:
The flow rate is generally the flow rate within a UV channel containing a specified number of lamps. A related parameter to the hydraulic loading is the UV loading (expressed as L/S’W) calculated as the flow rate can be disinfected per watt of lamp output (calculated by multiplying the number of lamps in Equation 2 by the rated UV output of each lamp, typically 26.7 W).
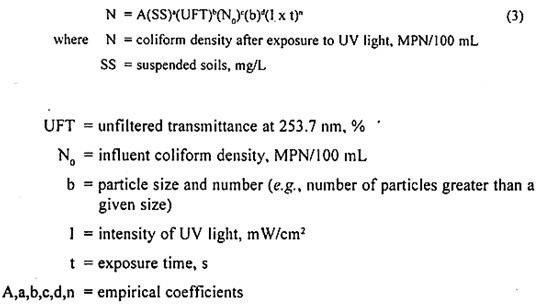
Several models have been proposed to calculate the allowable UV hydraulic loading at a particular wastewater treatment. In the approach proposed by Darby (1994) the following empirical equation is used in conjunction with a comprehensive design approach that integrates wastewater variability, the uncertainty in model predictions, and variable permit criteria in determining the allowable UV loading at a wastewater treatment plant.
The above model was developed for conventional activated sludge processes and for a UV reactor with flow parallel to the UV lamps. The exact functional form of Equation 3 is dependent on the specific wastewater characteristics of a particular treatment plant. The statistical significance of each parameter in Equation 3 is based on the p-value of the multiple linear regression used to determine the model coefficients.
A p-value less than 0.05 indicates a statistically significant correlation between a particular parameter and the effluent coliform concentration after exposure to UV light. Generally parameters that are relatively constant for a particular treatment plant (e.g., particle size distribution) have p-value’s greater than 0.05 and can be omitted from Equation 3.
Pilot scale testing is necessary to determine both the exact functional form and the corresponding model coefficients for a particular wastewater treatment plant. Examples of the exact functional form and the corresponding model coefficients are presented in Table 1 for two major Northern California wastewater treatment plants.
Design Considerations for UV Systems:
Regardless of whether UV dose or UV loading is used, the design of UV systems is based on a consideration of the following factors. Because the theory and practice of UV disinfection has been covered elsewhere, detailed explanations of the factors presented below are not repeated here.
Wastewater Characteristics:
i. Design flow rate (Peak week), m3/d (Mgal/d)
ii. Unfiltered transmittance, UFT
iii. Filtered transmittance, FT
iv. Suspended solids concentration, SS, mg/L
UV Facilities:
i. Lamp configuration [current industry standard lamp spacing is 75 mm (3 in) on centres],
ii. Configuration of the pilot scale UV disinfection facility (e.g., the number of lamps per module and the number of banks per channel. Generally a pilot scale UV disinfection system has only one channel).
iii. Effective arc length of lamp (Typically 147 cm).
iv. Diameter of the quartz sleeve (Typically between 23 and 25 mm).
v. Allowable head-loss across a channel (typically 50 to 60 mm, 12-15 mm per bank).
Regulatory Requirements:
i. Microorganism of concern (e.g., total or fecal coliform).
ii. Type of discharge standards (fixed such as a given value not to be exceeded and/ or probability-based such as 7-and 30-day running median).
iii. Minimum allowable wastewater transmittance value (e.g., 55 per cent) without the conduct of field studies (If continuous transmittance data have been collected for a minimum period of six months including wet weather periods, a lower minimum transmittance value may be allowed).
Probabilistic Approach to UV Design based on Field Studies:
In the probabilistic approach to UV system design, the variability of the experimental data and wastewater characteristics are considered in conjunction with the applicable regulatory requirements. From field studies, typically obtained using a pilot-scale disinfection system, the degree of microorganism inactivation is determined for a given lamp configuration for a number of different flow rates and water quality characteristics. Three UV banks in series are used most commonly.
Using the field data, the design procedure is outlined below:
Additional details on the probabilistic approach used in the following analysis may be found in Darby (1994):
I. Use the point source summation (PSS) method to determine the average UV intensity for the pilot scale lamp configuration for a range of wastewater transmission values. In computing the UV intensity, lamp output is not adjusted to account for lamp ageing or fouling. If the nominal lamp output (new at 100 hours) is in question, collimated beam tests can be performed to determine the lamp output. A typical PSS curve is illustrated in Fig. 2 for a 6 x 8 lamp array.
II. Using the results of the field studies, calibrate Equation 3 to obtain values of the empirical coefficients A, a, b, c, d, and n, the values given in Table 1 can be used to obtain a preliminary estimate of the allowable UV loading.
III. Obtain simulate one year’s worth of daily SS, UFT, FT, N0, and b values. The average UV intensity is determined using the Fig. 2 developed in step 1 and the FT values. An expanded data set is generated randomly selecting days (based on a uniform distribution) from the original data set.
IV. Assume a typical range of flow rates including values above and below those, used in the pilot system.
V. Determine the average detention time through the pilot scale UV disinfection system for each flow rate specified in step 4 using the following equation:
Detention time,
Based on a number of tracer studies, it has been found that the flow through a UV reactor is essentially plug flow with small amounts of axial dispersion.
VI. Use the following expression to predict the value of N for each of the 365 days for each of the flow rates specified in step 4 (see Table 2 for an example calculation; the model coefficients for the second calibrated model reported in Table 1 were used to calculate the values in Table 2):
log N = log(A) + a log(SS) + b log(UFT) + c log(N0) + d log(b) + n log(I) + n log(t) + ε (4)
where ε = normally distributed random number with mean zero and standard deviation equal to the adjusted root mean square of the calibrated model. Other terms are as defined above.
As noted above, the values of the coefficients A, a, b, c, d, and n are derived from the results of the field tests. Alternatively, the values given in Table 1 can be used for a preliminary estimate. The values for SS, UFT, N0, and b were obtained in step 3. The average UV intensity, I, is obtained from the curve developed in step 1.
The corresponding detention time was determined in step 5. The error term, e, is generated using a random number generator (e.g., Microsoft Excel). Typical values of the error term are given in Table 2.
VII. Repeat step 6 for the flow rates specified in step 4. Convert the flow rates into hydraulic loading rates using the following equation:
The number of lamps and banks are in reference to the pilot scale UV disinfection system.
VIII. For each of the data sets (containing 365 predicted MPN values) generated for the flow rates considered in step 4, calculate a new data set containing the 7-day running median (see Table 2 for an example calculation).
In situations where 7- or 30-day average is used, calculate the average value every 7- or 30-days rather than every day based on a running median. Next count the number of times a value of 23 is exceeded for a given flow rate.
Plot the per cent of the time the value of 23 MPN/100 mL was not exceeded on log probability paper as a function of hydraulic loading (Fig. 3).
Repeat step 8 for the various permit requirements (e.g., 23 MPN/100 mL based on a 7-day running median and 500 MPN/100 mL not to be exceeded any given period). In Figure 3, similar computations are reported for expanded data sets of 730 and 1000 days (as compared to 365 days in step 3) for purposes of comparison.
IX. Select an acceptable value of probability that the specified permit requirements will not be violated (e.g., 99, 99.9, or 99.99 per cent). From the log probability plots generated in steps 8 and 9, select the corresponding hydraulic loading rate. The lowest hydraulic loading rate corresponds to the most stringent discharge limit and will be used in the design of a full scale UV disinfection facility.
X. Adjust the hydraulic loading to account for lamp aging and fouling. Generally the UV loading is reduced by 30% to account for lamp aging and an additional 30 per cent to account for lamp fouling (e.g., Hydraulic loading x 0.7 x 0.7). A typical per cent reduction in lamp output due to aging is illustrated in Fig. 4.
Using the maximum allowable hydraulic loading rate from step 11, determine the number of lamps required for disinfection in a full scale UV facility:
Number of lamps required for disinfection.
The design flow rate is defined as the flow rate that the full scale UV disinfection system will treat.
XI. Select a configuration that meets disinfection criteria with the minimum number of lamps.
XII. Compute the headloss per channel using a value of 2.2 for the head-loss coefficient (K).
Headloss per channel, mm =
If the head-loss across a UV channel is greater than 50 to 60 mm, either add additional channels and/or increase the lamp array size to reduce the head-loss to an acceptable value.
Deterministic Approach to UV Design Based on Collimated Beam Studies:
In the collimated beam test, a wastewater sample, of known depth, is exposed to a known UV intensity for different times and the degree of microorganism inactivation is
determined. The UV intensity is measured with a radiometer.
Using the laboratory data the design procedure can be outlined as follows:
I. Plot the log of the microorganism inactivation data obtained with the collimated beam versus the UV dose (Fig. 1). The UV dose is calculated by multiplying the average UV intensity expressed in mW/cm2 by the exposure time in seconds. The average UV intensity is calculated by measuring the intensity at the surface of the sample volume with a radiometer and then correcting the measured value for surface scatter and for sample depth using Beer’s Law.
It should be noted that the shape of the plotted curve will vary with the suspended solids concentration and the chemical characteristics of the wastewater (Fig. 5). Thus, with a single sample, it is impossible to know if the curve generated with a collimated beam is appropriate for use in the design of a full scale UV disinfection facility.
II. From the log inactivation versus UV dose plot prepared in Step 1, determine the UV dose required to meet the effluent microorganism discharge requirements.
III. Adjust the UV dose to account for lamp aging and fouling in the full scale UV disinfection facility. Generally the UV dose is increased by 30 per cent to account for lamp aging and an additional 30 per cent to account for lamp fouling (e.g., UV dose/(0.7 x 0.7)). A typical per cent reduction in lamp output due to aging is illustrated in Fig. 4.
IV. Use the point source summation (PSS) method to determine the average UV intensity for the given lamp configuration for a range of wastewater transmission values. Plot a UV intensity versus FT curve (Fig. 2).
V. Given a typical value of the filtered transmittance of the wastewater, determine the corresponding average UV intensity using Fig. 2.
VI. Determine the detention time required to meet the discharge requirements using the following expression:
VII. Based on the critical design flow rate (generally peak weekly flow rate), determine the volume of flow that must be retained for the detention time determined in Step 6.
Total volume, L = (detention time, s) x (design flow-rate, L/s)
VIII. Determine the number of lamps required for disinfection by dividing the total volume of flow to be disinfected by the volume of wastewater treated by each lamp.
IX. The volume per lamp is obtained by subtracting the cross sectional area of the quartz sleeve from a square area 75 mm x 75 mm and multiplying by the effective length of the UV lamp (typically 147 cm). A typical value using a 2.3 cm diameter quartz sleeve is 7.658 L.
X. Assuming various system configurations, select a configuration that meets disinfection criteria with the minimum number of lamps.
XI. Compute the head-loss per channel using a value of 2.2 for the headloss coefficient (K) for each bank.
Head-loss per channel,
If the head-loss across a UV channel is greater than 50 to 60 mm, either add additional channels and/or increase the lamp array size to reduce the head-loss to an acceptable value.
Deterministic Approach to UV Design Based on Field Studies:
In field studies, the degree of microorganism inactivation is determined for a given lamp configuration for a number of different flow rates and water quality characteristics.
Using the field data, the deterministic design procedure is as follows:
Plot the log of the microorganism inactivation data obtained from the field tests versus the UV dose. The UV dose is calculated by multiplying the average UV intensity expressed in mW/cm2 by the exposure time in seconds. The average UV intensity is calculated using the PSS method and the exposure time is calculated based on the assumption of approximate plug flow conditions within the UV reactor.
It should be noted that the shape of the plotted curve will vary with the suspended solids concentration and the chemical characteristics of the wastewater. The remaining steps in the design are as outline above for the procedure based on the use of laboratory collimated beam test results.
Comparison of UV Design Methods:
The advantage of the probabilistic approach is that the variability in the wastewater characteristics, the variability in the field test data, and the statistical nature of the discharge requirements are reflected in the in design of the UV system. The principal disadvantage is that field data must be obtained to model the disinfection process.
While the deterministic approach is simpler, especially where the design is based on collimated beam test results, the variability in the wastewater characteristics and the variability in the test data are not considered. The results of collimated beam tests are often compromised when wastewater samples are shipped to another location for testing.
If the water quality of the effluent is high, the results of the collimated beam test correlate well with the results of field tests, whereas with poor water quality the test results do not correlate well with the results for the field tests.
The Future:
In the future, the design and operation of UV disinfection systems will be based on on-line monitoring of wastewater characteristics and new equipment and equipment configurations.
On-Line Monitoring:
On-line monitoring devices are now available for the measurement of transmittance, suspended solids, particle size and particle size distribution, turbidity, and selected organic and inorganic chemical constituents.
As the use of on-line monitoring becomes more routine, it will be possible to take into account the variability of the wastewater characteristics in the design of UV systems. With on-line monitoring the operation of a UV system will be controlled on a real time basis.
New Equipment and Configurations:
The design of UV equipment is continually undergoing change, especially with respect to the output of the UV lamps. New lamps and ballasts have been developed and are currently being tested. In the design procedures set forth in the paper, changes in the lamp output can be accommodated easily.
As the output of the lamps is increased, it is anticipated that different lamp spacing will be used to optimize the design of the low- pressure UV disinfection systems. To limit the number of lamps, especially in wastewater effluents prone to biological fouling, the trend is to use medium pressure UV lamps equipped with a mechanical cleaning device.


