Brief outlines of the two types of diversity indices of biodiversity are discussed in this article.
The two types are: (1) Dominance Indices, and (2) Information-Statistic Indices.
1. Dominance Indices:
Dominance indices are weighted toward the abundance of the commonest species. A widely used dominance index is Simpson’s diversity index. It takes into account both richness and evenness.
Simpson’s Diversity Indices:
The term “Simpson’s diversity index” can actually refer to any one of 3 closely related indices.
Simpson’s Index (D):
Simpson’s index measures the probability that any two individuals drawn at random from an infinitely large community will belong to same species. There are two versions of the formula for calculating D.
Either is Acceptable but is to be Consistent:
where, n = the total number of individuals of each species, N = the total number of organisms of all species.
The value of D ranges between 0 and 1.
With this index, 0 represents infinite diversity and 1, no diversity. That is, the bigger the value of D, the lower the diversity. This does not sound logical, so to get over this problem, D is often subtracted from 1 or the reciprocal of the index is taken.
Simpson’s Index of Diversity 1-D:
This index represents the probability that two individuals randomly selected from a community will belong to different species. The value of this index also ranges between 0 and 1, but here, the greater the value, the greater the diversity.
Simpson’s Reciprocal Index 1/D:
The value of this index starts with 1 as the lowest possible figure. This figure would represent a community containing only one species. The higher the value, the greater would be the diversity. The maximum value is the number of species in the sample. For example, if there are five species in the sample, then maximum value is 5.
The name Simpson’s diversity index is often very loosely applied and all three related indices described above (Simpson’s index, Simpson’s index of diversity and Simpson’s reciprocal index) have been quoted under term, depending on authors.
As an example, let us consider the following table:
Putting the values into the formula for Simpson’s index:
Then, Simpson’s index of diversity 1 – D = 0.7 and Simpson’s reciprocal index 1/D = 3.3.
All these three values represent the same biodiversity. It is, therefore, important to ascertain which index has actually been used in any comparative studies of biodiversity. The disadvantage of Simpson’s index is that it is heavily weighed toward the most abundant species, as are in all dominance indices.
The addition of rare species with one individual will fail to change the index. As a result, Simpson’s index is of limited value in conservation biology if an area has many rare species with just one individual.
2. Information-Statistic Indices:
Information-statistic indices can take into account rare species in a community. Information- statistic indices are based on the rationale that diversity in a natural system can be measured in a way that is similar to the way information contained in a code or message is measured.
By analogy, if we know how to calculate the uncertainty of the next letter in a coded message, then we can use the same technique to calculate the uncertainty of the next species to be found in a community.
Shannon Index:
A widely used diversity index is Shannon index.
The Index is given by:
where, pi is the proportion of individuals found in the ith species and In denotes natural logarithm.
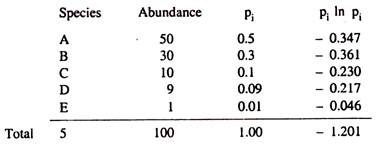
The following table gives an example:
Putting the values into the formula for Shannon index, Hs = 1.201
Even the rare species with one individual (species E) contributes some value to the Shannon index, so if an area has many rare species, their contributions would accommodate. Shannon index has a minus sign in the calculation, so the index actually becomes 1.201, not-1.201. Values of Shannon index for real communities are often found to fall between 1.5 and 3.5. The value obtained from a sample is in itself of no significance. The index becomes useful only while comparing two or more sites.
Brillouin Index:
A second information-statistic index, designed to reflect species abundance.
The Brillouin index and is given by:
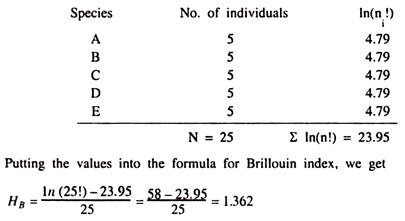
where, N is the total number of individuals in the community, ni is the number of individuals in the ith species.
The following table gives an example:
This index describes a known population. There is no room for uncertainty while using this index. It places more emphasis on species richness and is moderately sensitive to sample size.


